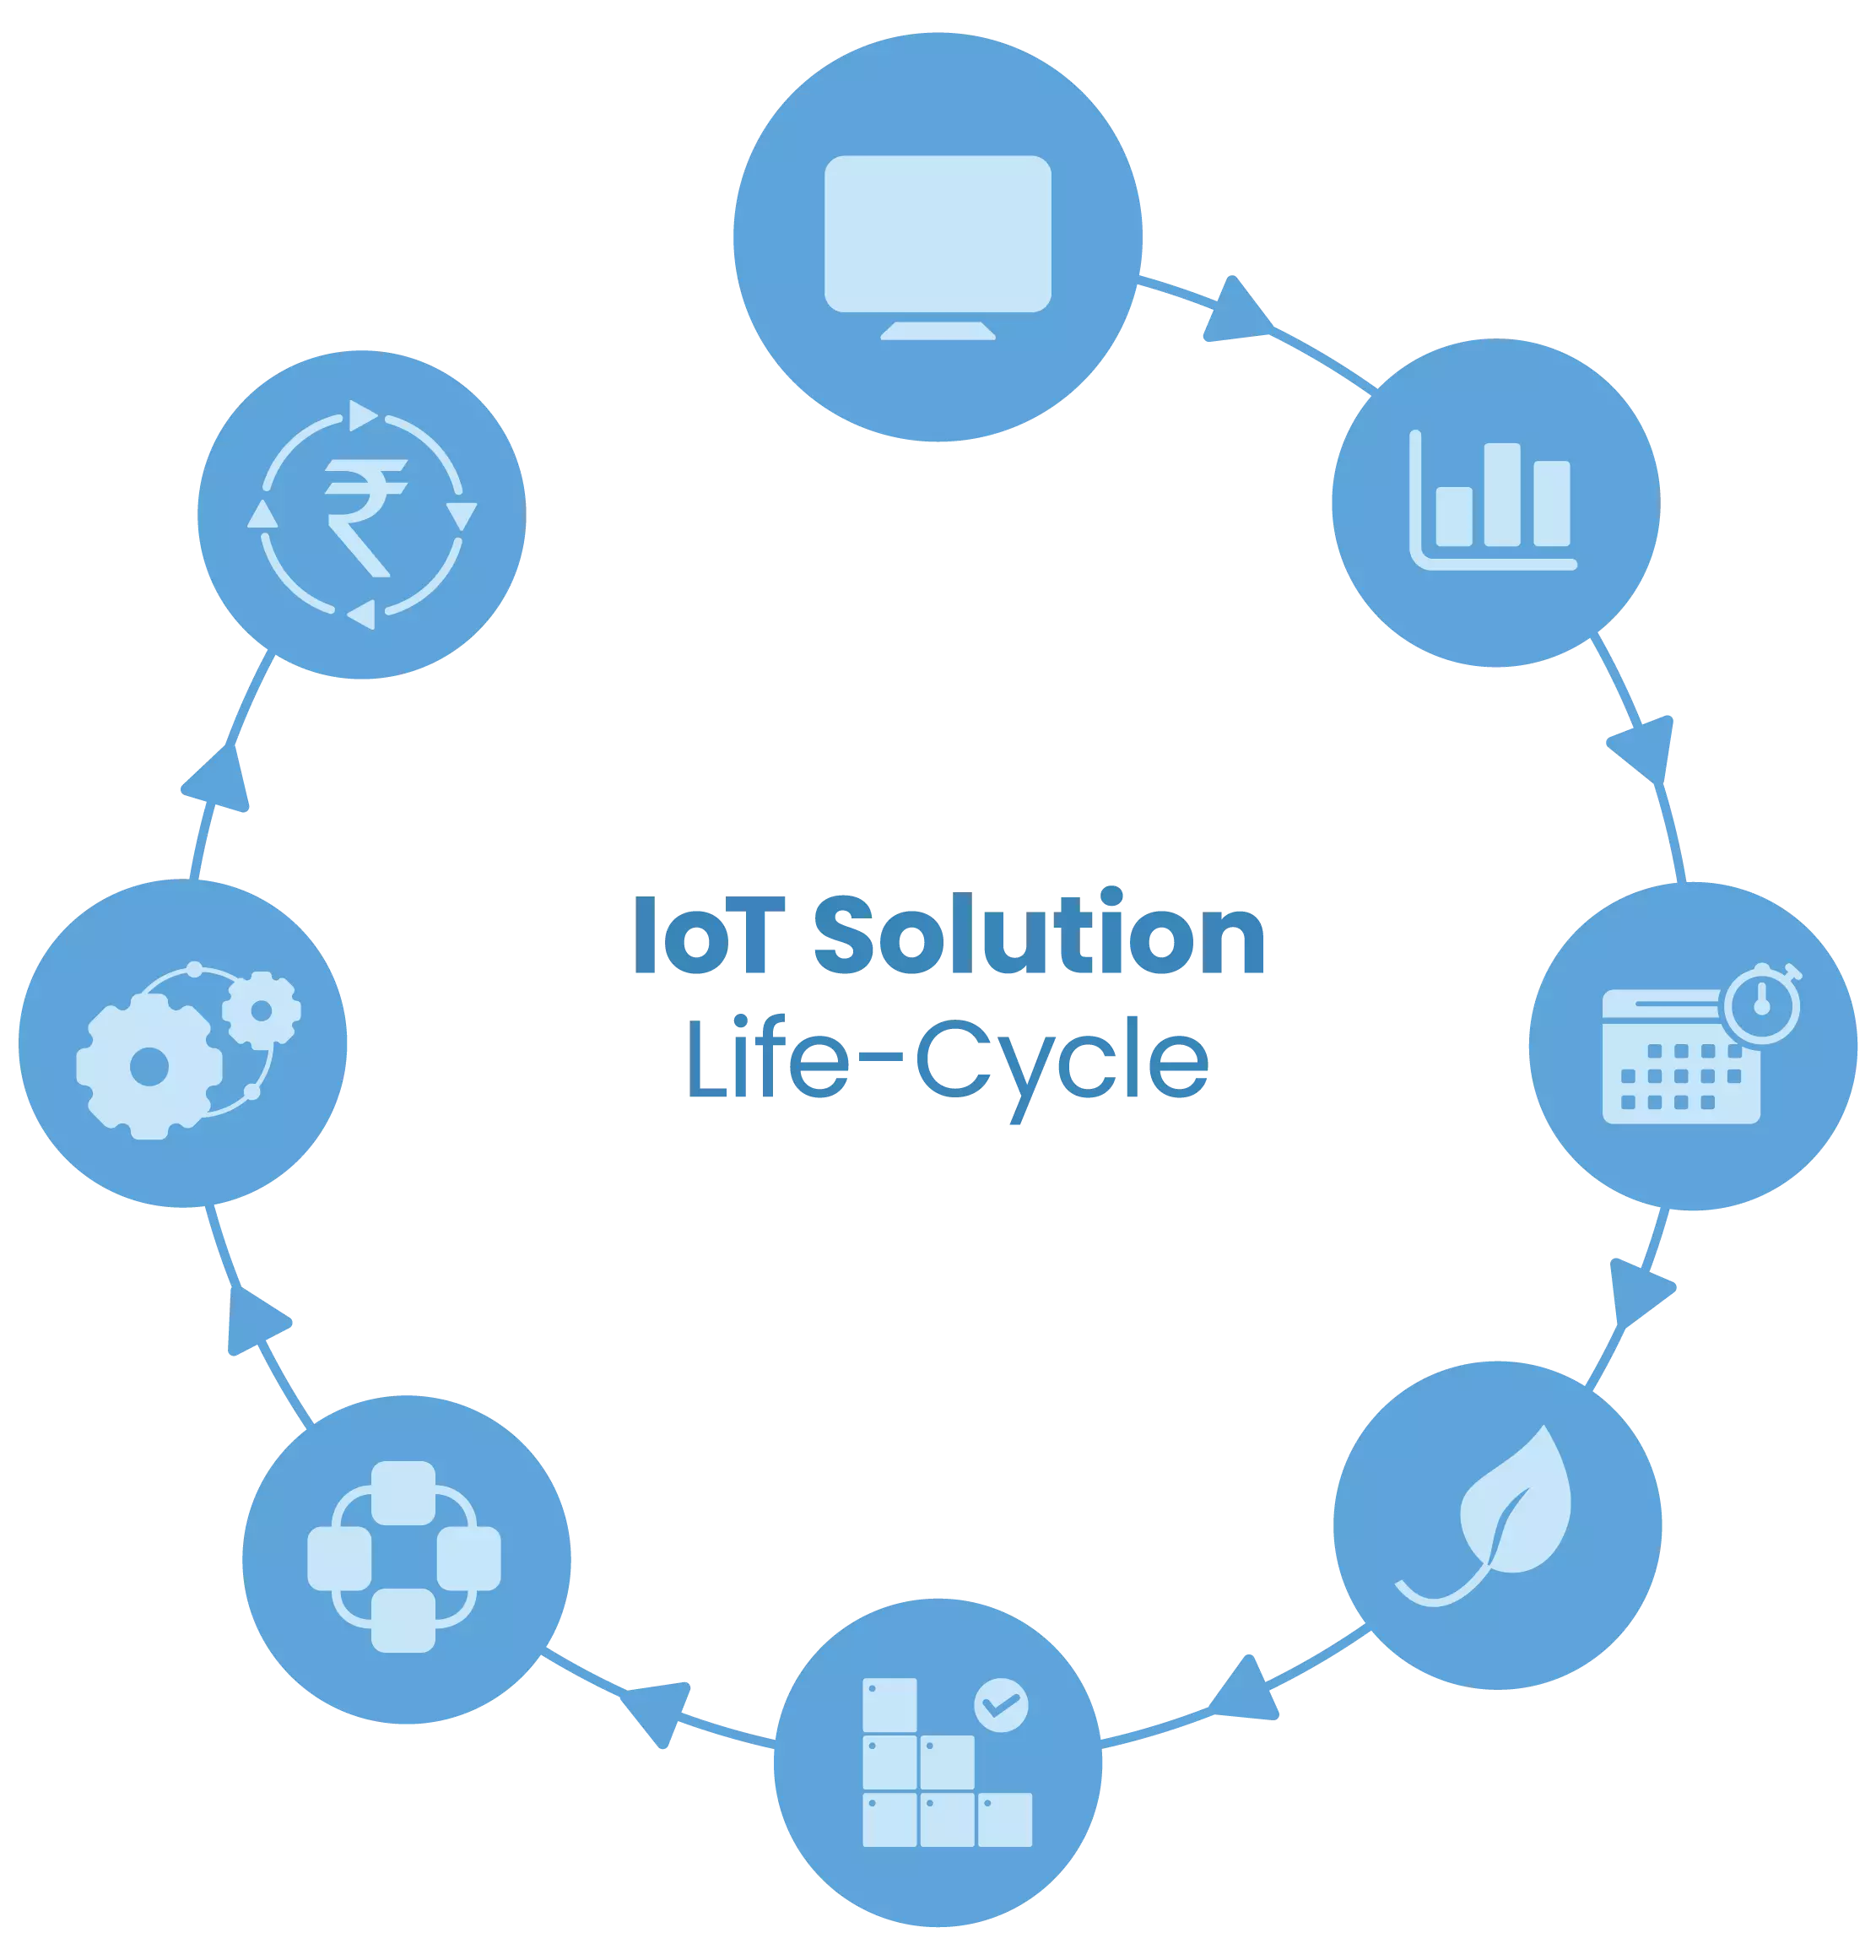
As is generally observed building automation roughly follows through a solution cycle of Analyses, Planning, Installation, Commissioning and Operations. We assist businesses by designing and implementing a well-rounded portfolio of solutions which follows this cycle and contribute to their long-term profitability and sustainability goals.
Our solutions use advanced communications and visualisation to help you monitor and control devices, create stats & reports, manage spaces, make projections and plans based on machine learning and AI and, raise bills and invoices towards use of resources.
IoT-based Monitoring & Control
Billions of electronic gadgets and devices run the post industrial digital world. While many devices are created for a particular function with built-in redundancies and failover mechanisms, a truly `aware’ device will have the capability to, talk about itself, and acquire instructions for its reason & purpose. This is where the Internet of things come-in.
An Internet-of-Things basically involves three main components:
Sensors/Actuators Node
They are devices that do the actual monitoring, control and data capture of the `Things' (machines, Ids cards, tools cars, environment etc.) Sensors `sense' or state the condition of the things, while Actuators control the same things (putting them on/off, high/low/fast/slow etc.)
Gateway Node
These are networking devices that are wired / wireless powered by battery, Power-over-Ethernet or DC; they provide for acquisition and transformation of the data produced acquisition and data transformations from the data produced by the sensors/actuators. The Gateway node is a mini computer device that can process data and assist in transmission of data and signals through wire or wireless radio frequency.

Servers/Cloud
This is the location where the data finally rests on hard-drives or in data centres, where in-depth processing and analysis takes place. At this level the data acquired from the downstream devices and processes are marked, tagged and sorted for softwares to make sense and lead to pictorial representations through dashboards, charts and diagrams.
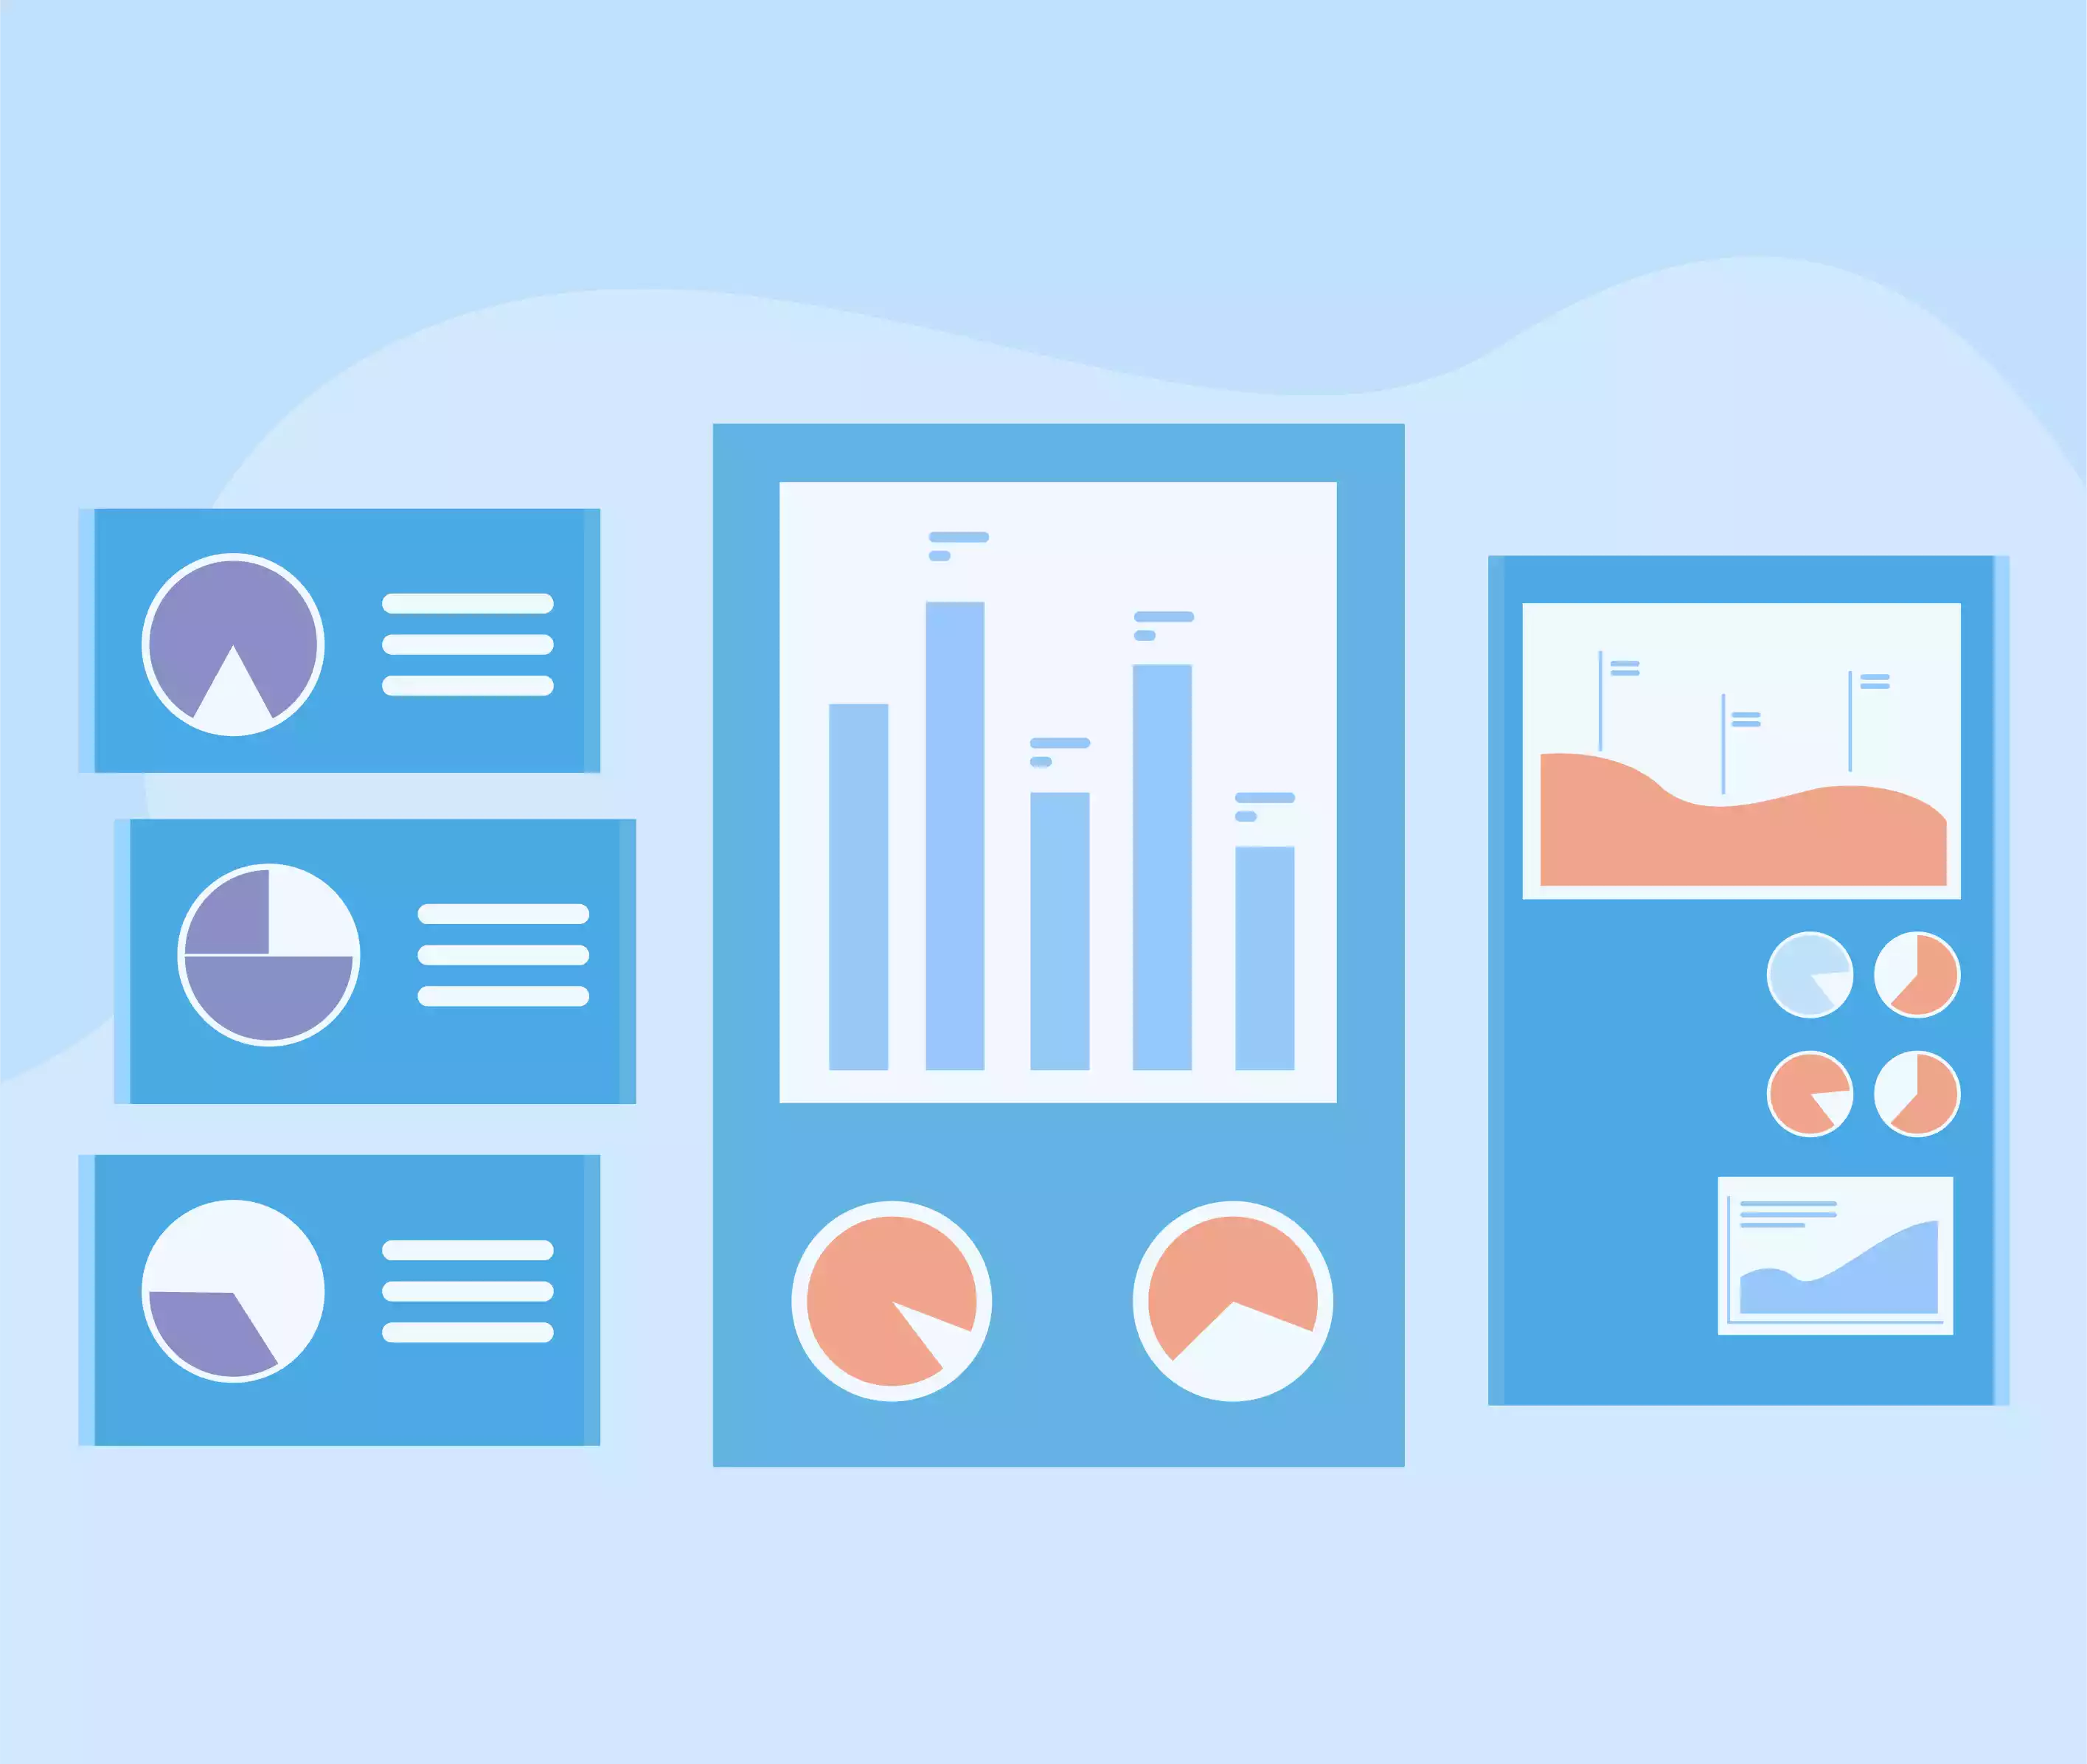
Reporting and Trending Analytics
Increase in speed and capacity of devices have given rise to an environment where businesses get lost in a maze of applications and a sea of data. The IoT environment only seems to compound the problem with an array of devices and data points.
Would you like to take a decision based on general experience and thumb-rule alone. How about, being able to see actual performance data and counters that list every instance and occurrence of an event.
Sonicbolt iBMS solutions plug into the data generators and devices intelligently, obtain and process the inputs and generate live charts and diagrams, so end users can monitor exactly what is going on, recognise observable trends and make the right decisions.
In order to leverage and respond to data generated and channelise them into meaningful information we need:
Work Management and Scheduling
In the age of hyper-automation and a profusion of Apps and Devices, simple routines like general spatial hygiene, premises upkeep, equipment health etc., needs to get to a place of orderliness, accuracy and convenience. How can we bring perspective and direction to mundane activities that run on impersonal and faceless systems and yet achieve the basic optimum in performance.
The requirement for timely action is met by deploying the right amount of personnel at the right place and time.
A smart iBMS will help in generating workflow and man-machine or man-task ratio that will enable a smooth running of an organisation or business. Some of the important work areas that can be attended by our system includes.
Energy Management
The population of our planet has increased from 4+ billion people, in the 1980s to almost double, at 7+ billion, in just under 40 years. The planet is powered today by an assortment of renewable & non-renewable energy, with the later bearing most of the burden of our Energy needs. World over, especially in developed countries, an emphasis on net-zero buildings is slowly gaining momentum.
There is a greater understanding today of the use and conservation of energy, and the way it can impact profits of an organisation. Energy requirements can take up a significant part of the total expenditure in running businesses around the world. Check with us how we implement our solution for an Energy efficient building.

Sonicbolt Energy management systems can:
Asset Management
Tracking and monitoring active and passive building assets is a 24/7 activity and, Sonicbolt iBMS systems are geared to detect, monitor and maintain such assets optimally leading to maintenance satisfaction.
How many devices should be allotted to an Area X in your office floor. Is it time to replace legacy devices. What is the frequency of use of an asset. Our building management system tracks the life-cycle of all active and passive assets in the building. Devices are tagged, registered, monitored and controlled to create a device layout
A better visualisation of your business assets is key to providing a better maintenance & inventory management, and this, directly impacts operational expenditure.

Our systems can help:
Space Management/Hot Desking
Rising Real estate prices have always been a continuous and universal phenomenon. Prices of work or living space has never been as costly as they are today. What we do with the available space so that we can accommodate more people in existing facilities is key to utilising physical space efficiently. Our solutions help implement space management & hot-desking measures based on need-to-use basis.
Drone cameras are the new rage for enhanced viewing delight and instinctively superior to static or two dimensional visual experience. So, the Sonicbolt space management tools use this dynamic virtual view for screening our buildings and premises without, physical intrusion and confounding security protocols.
The views are made by creating virtual mirrors of real premises with drill-down and walk-through capability within the building as well as around the perimeter, as in the real world…

Predictive Maintenance
Can we understand the health of an equipment or have full-body check up like we do for humans. Our Building Management system helps you place the right kind of sensors in the right place, that assist in generating data which give vital information about the state of equipments so as to provide valuable insights, pre-order parts and setup maintenance schedules. Our system also has the capability to interpret key data through machine learning and create heuristics to mitigate a problem area.
As devices and their components start generating operational data, they also become more easily understood for their performance variables. Sonicbolt iBMS makes it possible to tag, address and monitor a wide array of main and sub-components in a system and predict their performance through Machine Learning.
Our solutions reduce the time taken for preparation of resources by learning how they perform and making them quickly ready for uninterrupted service.
Automated Billing
A diverse set of variables, tied to various operating and maintenance cost, exist in a modern building premises. The implementation of IoT based monitoring & control enables us to understand more deeply the use of resources by different stakeholders. We can study the data and probe and understand the use of resources and its cost to company and return on investment.
How much building resources were used for a particular activity or person. How many rooms occupied, lights, HVAC hours were consumed. Data on these resources and their use can be derived from our Building management system and monetary values can be assigned to generate pay-per-use scenarios as needed.
Sonibolt iBMS helps identify and distribute cost centres to various users and uses, raise Automatic bills & invoices, and furnish supporting statements that give details of usage.